

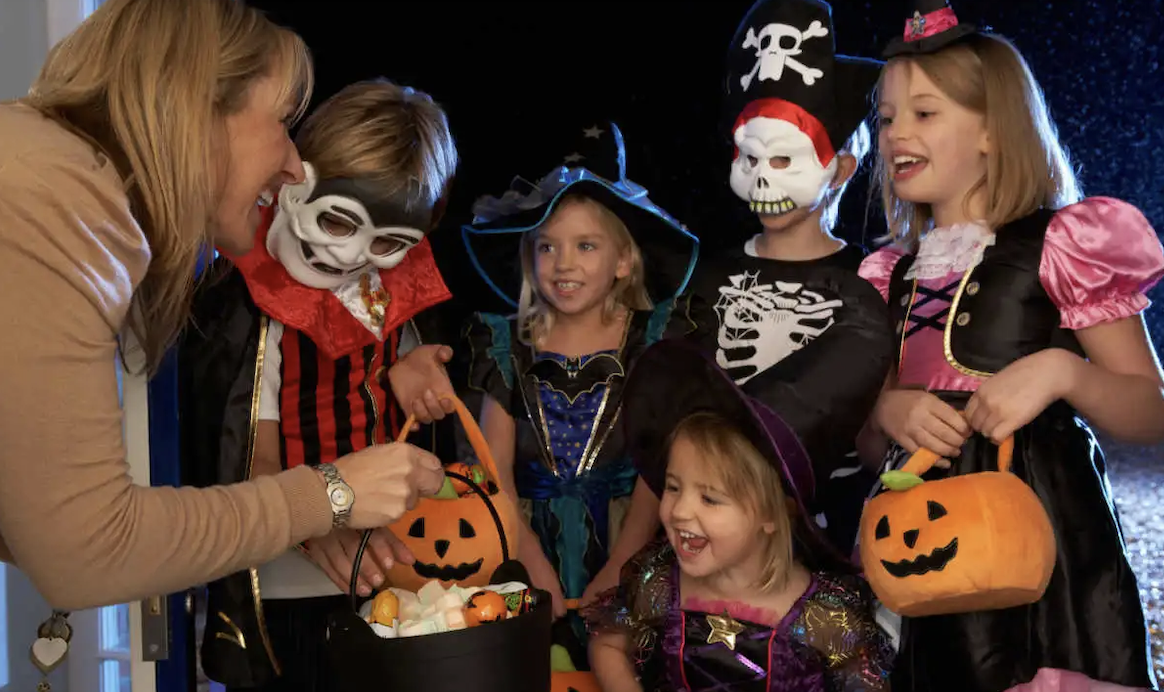
Americans are on track to spend more on Halloween than they ever have, even though the holiday still revolves around candy, a costume and a carved pumpkin. For families, and for the growing crowd of adults who dress up too, October has turned into a real line in the household budget.
In this article we will explore the record forecast, how the money splits among candy, decorations, costumes and pet outfits, when and where people shop, and how to plan a Halloween you enjoy without overspending.
The record numbers and what they measure
The National Retail Federation, the main US retail trade group, publishes an annual Halloween forecast based on a survey run by Prosper Insights and Analytics. The latest round was collected from 1 to 9 September 2026, and it points to a record $13.5 billion in total spending. The previous record, set in 2025, was $13.1 billion. Spending per person is projected at $115.14, compared with $114.45 a year earlier. All of these figures describe US consumers; Halloween is also marked in Canada, Ireland, the UK and parts of Europe and Latin America, but those markets differ in scale, habits and prices and are not covered by this survey.
Total spending versus spending per person
Two numbers in that summary move at very different speeds. The national total rises by roughly 3 percent, while the per-person figure climbs by only 69 cents. That gap says the extra money is not coming mainly from each shopper opening a bigger wallet. A large share of it comes from more people taking part, plus the plain arithmetic of a larger population.
For a household, the useful reading is that the average Halloween shopper is spending close to what they did last year, not dramatically more. If your own plans feel pricier than before, that is probably down to the specific items you buy, such as a branded costume, rather than a general rise in what the holiday demands.
Participation is the quiet driver
According to the survey, 74 percent of consumers plan to celebrate this year. That compares with 73 percent in 2025 and 68 percent in 2019, so the holiday has gained six percentage points of participation over the period. Across a country this size, a few points of extra participation means millions of additional shoppers.
The most common activities show what people are really paying for. Handing out candy tops the list at 61 percent, followed by dressing in costume at 50 percent. Decorating the home or yard, carving pumpkins and watching scary movies each come in at 42 percent. Only one of those, the movies, can be done almost for free, which helps explain why the total keeps climbing.
Why a record is not the same as a boom
Records in dollar terms are easy to set when prices drift upward, because the same bag of candy or costume simply costs more each year. Forecasts like this are normally stated in current dollars, so it is worth treating the word record as a statement about money spent rather than about the number of items bought. Retailers care about dollars either way, since dollars are what fill the till.
There is also a cultural reason the line keeps rising. Halloween has moved from a children’s evening to a month-long season with parties, themed decor and social media content. A holiday with no fixed gift obligation and no travel is an easy place for people to spend a little extra, and the survey suggests more of them do so each year.
How to read a survey-based forecast
It helps to know what kind of number this is. The Halloween total is not a count of till receipts. It is built from answers that consumers give about what they expect to buy, scaled up to the national population. People can misjudge their own plans, and bad weather, a sudden price rise or a change in the news can alter behavior between early September and the end of October. That is why forecast totals and later measured sales rarely match exactly, and why the direction of travel, here upward for both participation and total spending, is more reliable than any single decimal.
Who is affected by the trend? Retailers and manufacturers most obviously, since seasonal goods are planned months in advance and a good season clears shelves while a weak one leaves stock to be discounted. Local communities feel it too, because Halloween supports pumpkin farms, event venues and small shops that earn a large part of their year in a few weeks. For households, the stakes are smaller but more personal, because the holiday arrives just as heating bills, school costs and the wider holiday season begin to demand attention.
Candy, decorations and costumes split the money
The survey breaks spending into categories, and the shape of the table below is more interesting than any single line. Candy reaches almost everyone, while costumes collect the largest pot of money from a smaller group of buyers.
| Category | Share of consumers buying | Expected spending |
| Candy | 96 percent | $4.1 billion |
| Decorations | 78 percent | $4.3 billion |
| Costumes | 71 percent | $4.4 billion |
| Greeting cards | 42 percent (up from 38 percent) | $0.8 billion |
The category figures are rounded, so they are best read one at a time and not added together to match the headline total.
Candy is close to a universal purchase at 96 percent, yet it ranks third in dollars. That makes sense: a few bags of fun-size bars cost less than a full costume, and most buyers spend modestly. Decorations and costumes are the opposite case. Fewer people buy them, but those who do tend to spend larger sums, because a single inflatable, a lighting set or a detailed outfit can cost as much as several bags of sweets.
Greeting cards are the small surprise. They are bought by 42 percent of consumers, up from 38 percent, which suggests Halloween cards have become a modest habit and not just a novelty. At $0.8 billion the category is small, but a rise of four points in a single year is a notable move for any seasonal product.
For shoppers, this spread points to where savings are easiest. Candy is where bulk buying and store promotions matter most, since you are buying a lot of units at low prices. Decor and costumes are where one decision can swing your total, so that is where it pays to slow down and compare options before committing.
Decorations and the rise of the yard display
Decorations are the second-largest category at $4.3 billion, bought by 78 percent of consumers, and they are the part of Halloween that has changed most in style. Where a paper skeleton and a carved pumpkin once did the job, many homes now feature large inflatables, projected lighting and elaborate yard scenes. These items are durable, so they can be reused, and that changes the math. A decoration that costs more but comes out of storage for several seasons can be cheaper per year than a bargain set that breaks after one night of wind.
The activity data fits this picture. Decorating the home or yard and carving pumpkins each attract 42 percent of consumers. Pumpkin carving is among the cheapest traditions, since a pumpkin and a knife or a set of markers are enough. Anyone trying to keep the decor budget under control can lean on natural materials such as pumpkins, gourds and cornstalks, which are seasonal and widely sold, and then add one or two statement pieces instead of filling the entire yard.
Costumes for children, adults and pets
Costumes are the largest category at $4.4 billion, and the survey divides them into three groups with quite different stories. Children account for $1.5 billion, adults for $2 billion and pets for $0.92 billion. Adults outspend children by a clear margin, which surprises people who think of Halloween as a kids’ event.
What children are wearing
Superheroes dominate the children’s list. Spider-Man leads with 4.6 million costumes, followed by a general superhero outfit at 2.3 million and princess at 2.2 million. Witch and ghost each reach 1.6 million. The survey reports these as counts of costumes, so they give a sense of relative popularity rather than exact sales.
The pattern is familiar to parents: children follow whatever characters dominate films, streaming and school playgrounds. That makes licensed costumes pricey and short-lived, since a child may lose interest in a character by the following year. Hand-me-downs, costume swaps with neighbors and homemade variations on a classic witch or ghost remain the cheapest way through the season.
What adults are wearing
Adults lean on classics. Witch tops the list at 4.8 million, vampire follows at 4.2 million, Batman reaches 2 million, Spider-Man 1.5 million and ghost 1.4 million. Several of these can be assembled from items already in a wardrobe, plus a hat, cape or makeup, which is worth remembering if you are tempted by a full packaged outfit.
Adult spending is higher than children’s partly because grown-ups attend parties and events where the outfit matters, and partly because adult costumes tend to cost more per piece. The same logic applies to wigs, props and makeup, which add up quickly. A sensible rule is to decide the maximum you will pay for the whole look before you open any shopping tabs.
What pets are wearing
Pet costumes account for $0.92 billion, which is a notable amount for a category many people would not have predicted a decade ago. In the survey, the pumpkin leads at 11.6 percent, followed by the hot dog at 5.9 percent and the ghost at 2.8 percent. The survey summary does not say exactly which group those percentages are measured against, so treat them as a ranking of what is popular among pet outfits, not as a count of animals.
Pet owners should keep the animal’s comfort in front of everything else. A costume should not cover the eyes, restrict breathing or movement, or include small pieces that can be chewed off. Try it at home for a few minutes first, and be ready to take it off if the animal seems stressed. Many animals are happier in a simple bandana than in a full outfit, and it costs a fraction of the price. Chocolate and some sweeteners in candy are dangerous for dogs, so keep the treat bowl out of reach; for personal advice on a specific animal, a veterinarian is the right source.
Group and family themes
A practical way to manage costume spending is to coordinate. Families who pick a shared theme often buy fewer premium pieces and reuse accessories across outfits. The survey does not measure this directly, so take it as a sensible observation rather than a finding. Coordinated costumes also photograph well, which matters to people who share pictures online, and they make it easier to plan one shopping trip instead of several. If you try it, agree the budget for the whole group first, because one expensive outfit can quietly undo the savings from the rest.
Shopping starts earlier and spreads across channels
The calendar is one of the clearest trends in the survey. Forty-nine percent of Halloween shoppers say they begin shopping in September or earlier, up from 34 percent in 2016. In practice, retailers now stock seasonal aisles well before October, and consumers are responding by buying in waves instead of in one rush on the last weekend.
Where people buy
The survey lists four main channels. Discount stores lead at 39 percent, specialty Halloween stores follow at 32 percent, and online shopping accounts for 27 percent. Local and small businesses come in at 13 percent, up from 7 percent in 2016. Those shares add up to more than 100 percent, which means many people shop in more than one place, perhaps candy at a discount chain, a costume online and a pumpkin from a local farm stand.
The near doubling of the local and small business share is the quiet story here. It likely reflects a mix of pumpkin patches, farm stands, independent costume shops and craft sellers, though the survey summary does not break it down. For shoppers it is a reminder that the biggest chain is not automatically the cheapest, and that handmade or locally sourced items can be competitive on decor.
Timing: early selection or late markdowns
Shopping early has clear advantages. Popular children’s costumes and in-demand sizes sell out, and online orders need time to arrive and, if necessary, be exchanged. Shopping late has its own advantage, because leftover seasonal stock is often marked down in the final days. The right choice depends on what you are buying.
A workable approach is to split the list. Buy anything that must fit or that depends on a specific character early, while there is time to return or replace it. Leave candy and generic decor until later in October, when promotions are common, though you should check that stock is still available. Whatever you buy online, read the return policy before you pay, because seasonal items sometimes carry stricter rules than ordinary merchandise.
Planning around the quantity of candy
Candy is the item people most often overbuy. The survey shows 61 percent plan to hand it out, and many households purchase the same amount every year regardless of how many children knock. An honest look at last year’s trick-or-treater count, plus a small cushion, beats guessing high. Leftover candy keeps for a while, but it is still money spent on something you may not want to eat.
Why discount stores lead
Discount stores top the channel list at 39 percent for sensible reasons. Halloween purchases are mostly low-ticket and impulse-friendly, and shoppers who are already in a discount store for groceries or household items add candy, makeup or decor to the basket. Specialty Halloween stores, at 32 percent, win on selection and on costumes that discount stores do not carry, though prices there can be higher, especially in the final week. Online, at 27 percent, wins on range and convenience but adds delivery time and the hassle of returns.
The mix suggests that shoppers are matching the store to the item, and that is a good instinct. Buy staples where they are cheap, and spend extra only where selection or quality matters to you.
AI tools and search habits reshape the hunt for ideas
One of the more interesting findings is how people look for inspiration. Forty-seven percent of Halloween shoppers say they use AI tools in their shopping. The most common use is brainstorming ideas, at 34 percent, followed by product recommendations, at 32 percent. At the same time, online searches remain the leading source of costume inspiration at 32 percent, down from 37 percent.
Those two facts sit side by side without proving a link. The survey does not say that AI caused the dip in search, and other sources of ideas, such as social media and friends, may also be changing. Still, it is reasonable to read the pattern as a gradual shift in how people begin a shopping task: instead of typing a keyword and scrolling through results, many now describe what they want in plain language and let a chatbot suggest options.
AI tools are good at generating ideas. If you ask for a couple’s costume that can be built from thrift items, or a low-cost group theme for a classroom, you will often get workable suggestions in seconds.
They are weaker at facts that change quickly. Prices, sizes, availability and shipping times can be out of date or simply wrong, so treat any figure from a chatbot as a lead to check on the seller’s own site. Recommendations may also be influenced by sponsored placement or affiliate arrangements, which is not always obvious from the answer itself.
A few habits keep this safe. Do not paste sensitive personal details, such as your full address or payment information, into a chatbot. Be careful with photos of children. Compare any suggested product on the retailer’s page, read recent reviews, and confirm the return rules. Used that way, AI is a handy brainstorming partner and a poor replacement for the last step of checking the price.
Specific instructions are what make these tools worth using. A chatbot can turn an hour of browsing into five minutes, but only if you give it limits. Tell it your budget, the ages involved, the materials you already own and any practical needs, such as a costume that fits over a winter coat. Detailed requests produce more useful answers and cut down on the generic suggestions that steer you toward expensive packaged outfits. If the tool recommends a product, ask why, and then confirm the claim independently. For teachers and parents organizing group events, it can also help draft a simple supply list, which is a low-risk use that involves no personal data.
A sensible order of choices for your own budget
Because the typical Halloween shopper spends around the survey average, a good plan starts by deciding what Halloween is worth to your household, then working backward. The steps below keep the decisions in a sensible order, from the largest swing items to the smallest. This is general information, and the right number depends on your circumstances.
Set a ceiling before you shop
Pick a total for the season and write it down. Use the survey average of $115.14 only as a reference point; plenty of households will sensibly spend less, and some will spend more. Having a number in advance makes every later decision easier, because you can ask whether an item fits inside it.
Rank the categories
Decide which categories matter most. If your children care about costumes, protect that line and trim decor. If you host a party, put money into food and lighting and keep costumes simple. The survey shows people are spreading money across candy, decor and costumes, but no household needs to match that mix.
Reuse, swap and make
Check what you already own before buying. Last year’s decorations, a dark cloak, face paint and a simple prop can produce a decent costume. Swap outfits with friends or neighbors, and look for secondhand shops, which carry a surprising amount of costume material in the weeks before the holiday.
Buy in the right order
Begin with items that have limited stock or need to fit: children’s costumes, pet outfits and anything shipped from far away. Move on to decor, then buy candy last, once you have a realistic headcount. Keep receipts, and note the return deadlines on your calendar.
Keep it safe
Choose costumes with good visibility, a proper fit and flame-resistant labels where available. Add reflective tape or a flashlight for children walking at night. Keep decorative candles away from fabric, and use battery-powered lights where small children or pets are around. These steps cost little and protect the one thing no budget can replace.
Plan the day after
Halloween spending does not end on 31 October. Decorations need storage, and leftover candy needs a plan. Pack away reusable items in labeled boxes so they are easy to find next year, and note which pieces broke or disappointed so you do not buy them again.
Post-holiday clearance sales can be a good time to pick up next year’s reusable decor, if you have the space and the discipline. Leftover candy can be frozen, shared at work or donated where programs accept it; check local rules about sealed packaging first.
A short note on what you spent compared with your ceiling is the most useful thing to keep, since it turns this year’s experience into a better plan for the next.
Read more about Newstwick
Frequently Asked Questions
1. How much will Americans spend on Halloween this year?
According to the National Retail Federation survey conducted by Prosper Insights and Analytics, total spending is expected to reach a record $13.5 billion. That compares with $13.1 billion in 2025. Per person, the projection is $115.14.
2. What percentage of people celebrate Halloween in 2026?
The same survey found that 74 percent of consumers plan to celebrate, up from 73 percent in 2025 and 68 percent in 2019. These figures describe the United States, and participation in other countries varies.
3. What are the most popular Halloween costumes?
For children, Spider-Man leads at 4.6 million costumes, ahead of superhero and princess outfits. For adults, witch comes first at 4.8 million, followed by vampire at 4.2 million. Among pet costumes, the pumpkin is the top choice at 11.6 percent.
4. How much is spent on pet Halloween costumes?
The survey puts spending on pet costumes at $0.92 billion. Children’s costumes come to $1.5 billion and adult costumes to $2 billion. Pet owners should prioritize comfort and safety over appearance.
5. When should I start shopping for Halloween?
Many people start early: 49 percent of shoppers begin in September or earlier. Buying costumes and anything that must fit early gives you room to exchange items, while candy and general decor can wait until promotions appear later in October.
6. Do people really use AI to shop for Halloween?
Yes, according to the survey, 47 percent of Halloween shoppers use AI tools. They mostly use them to brainstorm ideas (34 percent) and to get product recommendations (32 percent). Prices and availability should still be checked on the seller’s own site.