

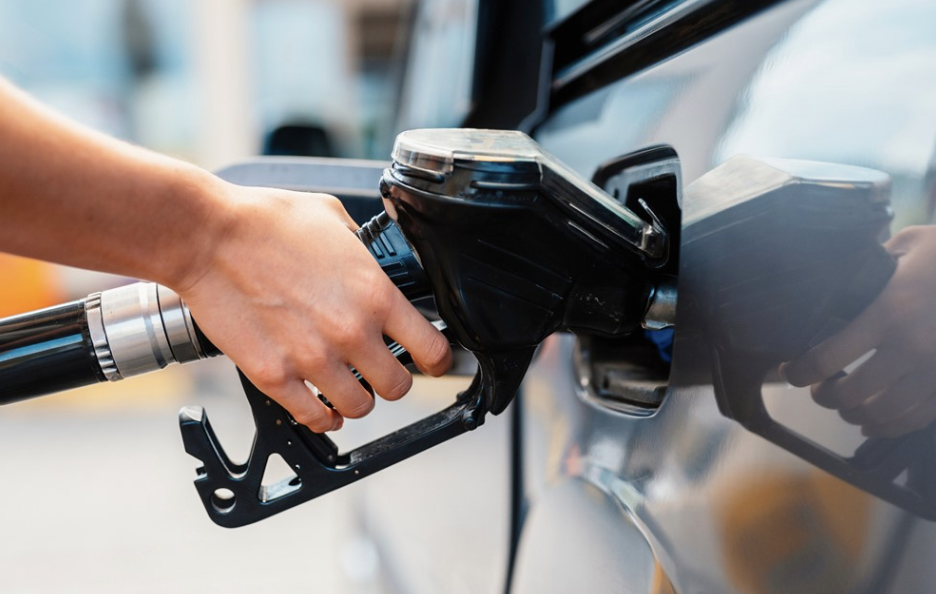
Filling up costs less this week than it did a month ago, yet the national average is still far above where it stood a year ago. That is the awkward position drivers find themselves in, and it affects commuting budgets, delivery costs, and the price of almost everything shipped by truck.
In this article, we will explore where the national average sits, what moved crude and fuel supplies, how states differ, what seasonal blends do, how electric charging compares, and what you can do at the pump.
Where the National Average for Gas Prices Stands
The simplest answer to the question most readers are asking comes from AAA. In its article dated November 5, the national average for a gallon of regular gasoline was $4.1003. AAA also noted that prices had fallen for nearly two weeks, and that before 2026 the national average had never climbed above $4 per gallon during any November. This coverage is about the United States; other countries price fuel per liter, tax it differently and follow different crude and currency movements.
The Week, Month and Year Comparison
The table below sets the November 5 price against the earlier readings AAA published. The differences are simple arithmetic based on the figures in the table.
| Point in time | National average, regular | Difference from November 5 |
| November 5 | $4.1003 | None |
| One week earlier | $4.2258 | Down about 12.6 cents |
| One month earlier | $4.3653 | Down about 26.5 cents |
| One year earlier | $3.0790 | Up about $1.02 |
The year-over-year gap is the number that explains why the relief feels limited. A fall of roughly 26.5 cents from a month earlier is a real saving, but it leaves the price more than a dollar above the year-earlier level. As simple arithmetic, the monthly drop is about 6 percent, while the gap with last year is about a third.
The Later Readings on the Live AAA Page
AAA keeps a live figure on its fuel prices page, and when this article was prepared that widget showed $4.0371 on November 7 and $4.0203 on November 8. These later numbers come from the live AAA page and not from the dated article. They suggest the slide continued past November 5, and by simple arithmetic the national average was about 8 cents lower on November 8 than three days earlier. Because the widget updates daily, the number you see when you visit will differ, which is why the dated article is the better reference for a fixed comparison.
Why the Dollar Threshold Draws Attention
AAA’s remark about $4 is worth a moment. Round numbers matter because they shape how drivers talk about prices and how they behave: when the sign at the corner station starts with a 4, people notice. The note that no November before 2026 had ever seen a national average above $4 puts the current level in historical context without needing any forecast. It also explains why the nearly two weeks of declines have drawn attention even though the level is still elevated.
Crude Oil, Inventories and Demand Behind the Slide
Gasoline prices follow crude oil more closely than almost any other input, because crude is the raw material. When crude rises, pump prices tend to climb within days, and when crude falls they usually drift down more slowly, which is why a drop in one often shows up later in the other. The AAA notes give a clear sequence for the recent run.
Crude Oil
AAA notes in earlier weeks said crude was near $100 a barrel on October 15 and October 22, and above $100 on October 29. Then West Texas Intermediate, the main US benchmark, fell $7.97 to settle at $88.12 a barrel on Wednesday, November 4. That is a large single-day move, and it fits the pattern of lower pump prices in the days afterward, although the national average had already been falling for nearly two weeks before it.
How Quickly Pump Prices Follow Crude
The link between crude and pump prices is real but not instant. Retailers buy fuel at wholesale prices that move daily, and many stations adjust their signs more eagerly when costs rise than when they fall. That lag is why a sharp one-day crude drop, like the $7.97 fall on November 4, rarely appears at the pump in a single step. It also means the national average can keep edging lower for days after crude stops falling, which is consistent with the later readings of $4.0371 and $4.0203 on the live AAA page.
Inventories
US crude stocks fell 0.9 million barrels to 409.8 million barrels, which is about 4 percent below the five-year average. Low stockpiles can keep upward pressure on prices because there is less cushion if supply is interrupted. Even so, a modest weekly decline in crude inventories did not stop the pump price from falling, which shows that the market was reacting more to the price of crude than to the stock level.
Demand and Production
According to the Energy Information Administration figures quoted by AAA, gasoline demand rose from 8.35 million barrels a day to 8.80 million. Total gasoline supply slipped slightly, from 209.2 million barrels to 209.0 million, while production rose from 9.24 million barrels a day to 9.70 million. In plain terms, Americans used more fuel in the week and refiners made more, with stocks edging down. A rise in demand tends to support prices, so the fact that the average still fell suggests the crude decline outweighed it.
States With the Highest and Lowest Prices
A national average hides wide differences. Local taxes, refinery access, pipeline distance and state fuel rules all play a part, and the order of the list changes only slowly. Texas and the Southeast tend to sit near the bottom and the West Coast near the top, which is exactly what the AAA ranking shows.
Most Expensive States
California led at $5.83, followed by Hawaii at $5.64, Nevada at $5.18 and Washington at $5.12. Oregon was at $4.73, Alaska at $4.71, Illinois at $4.60, Utah at $4.49, Idaho at $4.44 and Pennsylvania at $4.40. California’s price is about $1.73 above the national average by simple arithmetic.
Cheapest States
North Carolina had the lowest average at $3.34, then Georgia at $3.54, Texas at $3.58, South Carolina at $3.60 and Louisiana at $3.66. Tennessee was at $3.68, Alabama at $3.69, Arkansas and Indiana both at $3.71, and Mississippi at $3.73. The spread between California and North Carolina is $2.49 a gallon, so by simple arithmetic a driver in one state pays about 75 percent more per gallon than a driver in the other.
Why the Gaps Persist
Several ordinary forces keep the same states at the top and bottom. State and local fuel taxes differ, and some states require special gasoline blends that cost more to make. Distance matters too, since regions far from major refining centers pay more to move fuel in, and island or remote states such as Hawaii and Alaska face higher shipping costs. Meanwhile the Gulf Coast and parts of the Southeast sit close to refineries and pipelines. The sources here do not break the gaps down state by state, so treat these as general reasons and not as measured causes.
A Compact View of Both Lists
| Rank | Most expensive | Price | Cheapest | Price |
| 1 | California | $5.83 | North Carolina | $3.34 |
| 2 | Hawaii | $5.64 | Georgia | $3.54 |
| 3 | Nevada | $5.18 | Texas | $3.58 |
| 4 | Washington | $5.12 | South Carolina | $3.60 |
| 5 | Oregon | $4.73 | Louisiana | $3.66 |
Seasonal Fuel Blends and What They Change
AAA’s note on October 22 said part of the decline came from the switch to cheaper winter-blend gasoline. Fuel makers produce different recipes for different seasons. The summer blend is designed to evaporate less in hot weather, which reduces smog, and it costs more to make. In the cooler months refiners can use a blend that is cheaper to produce, and that change typically lowers prices at the pump independent of crude.
The practical meaning is that part of the autumn slide is a regular seasonal effect and not a sign of a trend. Someone comparing this November with last summer would be comparing different products. The comparison that avoids this problem is the one with the same month a year earlier, which is why the year-over-year gap of about $1.02 is the more reliable measure of how elevated prices are. The seasonal effect is also one reason the same pump price can feel different in different parts of the year.
Why the Blend Change Is Not the Whole Story
AAA’s wording is careful: the switch accounted for part of the decline, not all of it. The October 22 note sits alongside crude oil near $100 a barrel on that date, and the national average continued to fall afterward as crude dropped to $88.12 on November 4. A fair reading is that two things were happening at once, a routine change in the fuel recipe and a move in the raw material. The sources do not say how much each contributed, and we will not invent a split.
What Drivers Can Check
Drivers do not choose the blend, since it is set by the fuel supply system and by regulation, so there is little to do except notice the pattern. What is useful is to compare prices month to month with the same month of a prior year, and to be wary of any claim that a seasonal dip proves a lasting trend. If you keep a log of your fill-ups, you will see the seasonal rhythm in your own spending within a year or two.
Drivers and Businesses That Feel It Most
A national average is a blunt instrument, because the burden falls unevenly. Long-distance commuters, people in rural areas with no transit alternative, rideshare and delivery workers, and small businesses with vans all buy far more fuel than the typical household. For them, a change of 12 cents in a week is a real budget item and not a rounding error.
Commuters and Rural Households
A household that drives 40 miles each way to work uses many times the fuel of one that lives near the office. The recent fall in prices helps that household most, but it is also the one for whom a year-over-year increase of about $1.02 per gallon is hardest to absorb. Car-pooling, adjusting work schedules and combining errands are practical ways to trim miles.
Delivery, Freight and Small Firms
Fuel is a direct cost for trucking and delivery, and those firms often pass increases along through higher prices or fuel surcharges. That is how gasoline and diesel costs reach groceries and parcels, even for people who rarely visit a station. Small business owners should check their contracts for fuel surcharge clauses and keep mileage records, since fuel can be a deductible expense in many places, and an accountant can explain the rules that apply.
Electric Vehicle Charging Costs
For drivers weighing an electric car, the public charging price matters as much as the gasoline price. AAA reported an average of 42 cents per kilowatt-hour at public chargers, up one cent in a week. That is the opposite direction of gasoline for the week, so it is worth checking how the two compare in your area.
Where Charging Costs Most and Least
Hawaii was the most expensive at 55 cents, followed by West Virginia at 52 cents, Louisiana at 50 cents, and New Hampshire and California at 47 cents each. Kansas was the cheapest at 31 cents, with Missouri and Iowa at 33 cents, and Maryland and Utah at 35 cents. Louisiana is an instructive case: it ranks among the cheapest states for gasoline and among the dearest for public charging, so the cheaper fuel there is not electricity.
Home Charging Versus Public Charging
The 42-cent figure refers to public charging. Drivers who can charge at home normally pay their household electricity rate, which is generally lower than public station prices, though the rate and any time-of-use pricing vary by utility. That is why two electric car owners in the same state can report very different running costs. If you are weighing a switch, look at your own utility bill and at where you would charge before comparing against the pump.
An Illustration of Cost per 100 Miles
This is an illustration with invented round numbers, not a measured result. Suppose an electric car uses 30 kilowatt-hours per 100 miles. At the 42-cent average that costs $12.60. A gasoline car that returns 25 miles per gallon would use 4 gallons for the same distance, and at $4.10 a gallon that is $16.40. The real gap depends on your vehicle, your driving and, for electric cars, how much charging you do at home, where electricity is usually cheaper than at public stations. Readers should check their own rates and fuel economy before drawing conclusions.
Comparing This November With Last Year
The first column below sets out the comparisons AAA supports. The third column shows the direction.
| Comparison | Reading | Direction |
| Week earlier to November 5 | $4.2258 to $4.1003 | Lower |
| Month earlier to November 5 | $4.3653 to $4.1003 | Lower |
| Year earlier to November 5 | $3.0790 to $4.1003 | Higher |
| November 5 to November 8 | $4.1003 to $4.0203 | Lower |
The central fact of the story is the distance between this year and last. At $4.1003 against $3.0790, the national average is about $1.02 higher, or by simple arithmetic roughly 33 percent. That kind of gap compounds across a household’s year. The slide of recent weeks has softened the blow without removing it.
Why a Single Year-Over-Year Number Can Mislead
Comparing one date with the same date a year earlier is useful, but it is a snapshot. A year ago may have been unusually low or ordinary, and the sources here give no history in between. The fair statement is narrow: on November 5 the national average was above the level of a year earlier by about $1.02, and AAA’s remark about November never previously topping $4 shows that this is unusual for the month. Beyond that, readers should not assume a long-run direction.
A Household Budget Illustration
Here is another illustration with invented round numbers. Suppose a household buys 40 gallons of regular in a month. At the difference of about $1.02 per gallon, that is roughly $41 more than the same purchase would have cost a year earlier. A household that drives more, or commutes in a larger vehicle, would feel proportionally more. Those who drive little will notice it less, but the cost also arrives indirectly through freight and delivery.
What Remains Unknown
The sources do not tell us where prices go from here, and we are not making a forecast. What can be said is limited to the facts above: crude fell sharply in early November, the national average had fallen for nearly two weeks, and the live AAA page showed further small declines on November 7 and 8. Those facts describe the recent direction, and they are not a promise about the next one. Readers who want to follow along can check the AAA fuel prices page, which updates daily.
Saving Money While Gas Prices Stay High
Prices that are falling but still high call for habits, not hope. A few steps cost nothing and can add up over a year, and none depends on guessing where the market goes next.
Compare Before You Fill
Station prices can differ by tens of cents within a few miles, and the difference tends to be larger near highways and in dense city centers. Gas price apps, and the fuel prices page that AAA maintains, show local variation. A short detour is worth it only if the saving covers the extra fuel, so for small fills it rarely pays to cross town.
Fill up With a Plan, Not a Panic
Since the national average has been drifting lower, there is no reason to top off a tank in a hurry. Buying what you need, when you need it, avoids paying for fuel you may not use for weeks and keeps you flexible if the local price moves. Avoid stations right beside highway exits when a cheaper one is a short drive away, and check whether a membership club or grocery chain offers a lower price. The sources contain no forecast, so any plan built around waiting for a particular price is a gamble, not a strategy.
Watch Your Own Driving
Tire pressure, trunk clutter and rapid acceleration all affect fuel use. Keeping tires properly inflated is a simple, low-cost step that keeps fuel economy where the manufacturer intended. Combining errands into one trip keeps the engine warm and cuts the total miles driven.
Use Rewards and Payment Methods With Care
Many grocery chains and credit cards offer cents-per-gallon discounts or cash back on fuel. Check the terms, since some cap the number of gallons or apply only at certain stations. Avoid carrying a credit card balance to chase a fuel discount, because the interest will cost more than the saving.
Plan Long Trips With the State Map in Mind
Because the state gaps are so wide, a road trip across several states can pass through very different prices. Filling up before crossing into a high-price state such as California, or after leaving it, can save a noticeable amount on a large tank. A quick look at the state list before a long drive costs nothing. Prices also vary by city and by station inside each state, so the state average is a guide and not a rule.
Think About the Bigger Decisions Slowly
If high prices have you considering a different vehicle, resist deciding on one week’s price. A car purchase runs for years, and fuel costs are only one part of it. Compare total ownership costs for your driving habits, including charging if you are considering an electric car, and speak with a financial adviser if the purchase is large.
Conclusion
The AAA data shows a national average that has slid for nearly two weeks, from $4.3653 a month before November 5 to $4.1003 on that date, with later live readings lower still. It also shows prices more than a dollar above last year, a ranking where California costs about $2.49 more per gallon than North Carolina, and a seasonal blend change that explains part of the decline. The sensible reading is cautious: enjoy the lower bills, keep your habits efficient and check the official AAA page for fresh numbers before making plans around them.
Frequently Asked Questions
How Much Is the National Average Gas Price Right Now?
AAA put the national average for regular at $4.1003 on November 5. Its live page later showed $4.0371 on November 7 and $4.0203 on November 8.
Why Are Gas Prices Falling in November 2026?
AAA pointed to a drop in crude oil, with West Texas Intermediate settling at $88.12 on November 4 after trading near or above $100 in late October. A switch to cheaper winter-blend gasoline also played a part, according to an October 22 AAA note.
Which State Has the Cheapest Gas?
North Carolina had the lowest average at $3.34 a gallon, followed by Georgia at $3.54 and Texas at $3.58. California was the most expensive at $5.83.
Is Gas More Expensive Than It Was a Year Ago?
Yes. A year before November 5 the average was $3.0790, so the current price is about $1.02 higher by simple arithmetic.
How Much Does Public EV Charging Cost per Kilowatt-Hour?
AAA reported a national average of 42 cents per kilowatt-hour, up one cent in a week. Kansas was the cheapest at 31 cents and Hawaii the most expensive at 55 cents.
Where Can I Check Today’s Gas Prices?
The AAA fuel prices page shows the national average and state figures, and updates daily. Local apps can show station-level prices near you.